38 Web Development Stats You Should Know in 2024

Most firms now have websites of varying quality. Some are true masterpieces of design, UX, and UI. Others look like they’ve been slapped together in a few minutes because the boss told somebody to create a website now … as cheaply as possible. The best websites can be a sensory pleasure for visitors and better marketing for their owners than a Super Bowl ad. Many high-quality eCommerce websites are a seamless extension of a brand’s bricks and mortar store.
In this post, we look at a selection of web design and web development statistics, examining what matters to web users today.
Web Development Stats You Should Know in 2024:
Web Usage Statistics

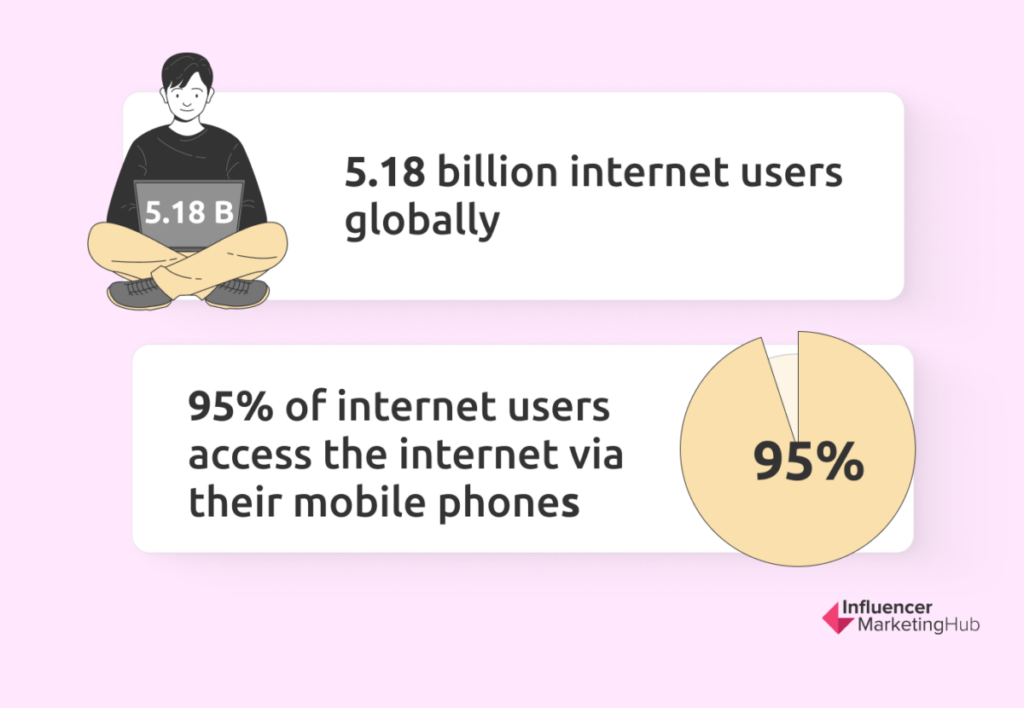
1. There are 5.18 billion internet users globally (Statista, April 2023). This is 64.6% of the world’s population (8.04 billion). That’s a growth of 146 million internet users (2.89%) year-on-year.
2. 85% of adults in the United States own a mobile phone (Zippia). Nearly all (85%) have a smartphone, with just 12% still owning an old-style feature phone.
3. 95% of internet users access the internet via their mobile phones (DataReportal). Even allowing for the fact that a few mobile phone owners don’t use them for the internet, it is clear that the vast majority of people do nowadays.
4. Only 58% of internet users aged 16 to 64 now use a laptop or desktop computer (Statista). However, there is clear evidence that web developers can’t ignore mobile users nowadays and possibly even design using a mobile-first philosophy. Other internet-enabled devices that people own are tablets (31.6%), games consoles (18.6%), smart watches/wristbands (27.4%), tv streaming devices (14.8%), smart home devices (14.9%), and virtual reality devices (4%).
5. However, 28.6% of internet users accessed the internet on a work laptop or desktop last year (ExplodingTopics). This suggests that many businesses still require computers, even if people do (most of) their recreational internet activity on their mobile devices.
6. Internet users average 6 hours and 40 minutes per day on the internet. The average user spends more than a third of that time (2 hours, 26 minutes per day) using social media.
7. 59.3% of internet users say their main reason for using the internet is to find information (Statista). Web developers should remember this when creating websites to ensure they contain valuable content. Other popular reasons people use the internet include staying in touch with friends and family (55.4%), keeping up-to-date with news and events (51.2%), watching videos, tv shows, or movies (50.6%), and researching how to do things (48%).
8. Google processes more than 99,000 search queries per second (HubSpot). That’s equivalent to more than 8.5 billion daily searches. Google averages 92% market share worldwide, depending on the day.
The Mobile Web Statistics
9. There are 5.56 billion unique mobile phone users, 69.5% of the world’s population. That’s a growth of 170 million internet users (3.2%) year-on-year.
10. The average internet user spends 57% of their daily internet time on their mobile phones (Statista). This further emphasizes how web developers cannot ignore mobile users when creating their sites.
11. The median speed of mobile internet connections is 42.07 MBPS when downloading (Statista). The median mobile upload speed is 10.33 MBPS. These speeds are still somewhat lower than median fixed internet speeds (69.14 MBPS – download / 29.09 MBPS – upload).
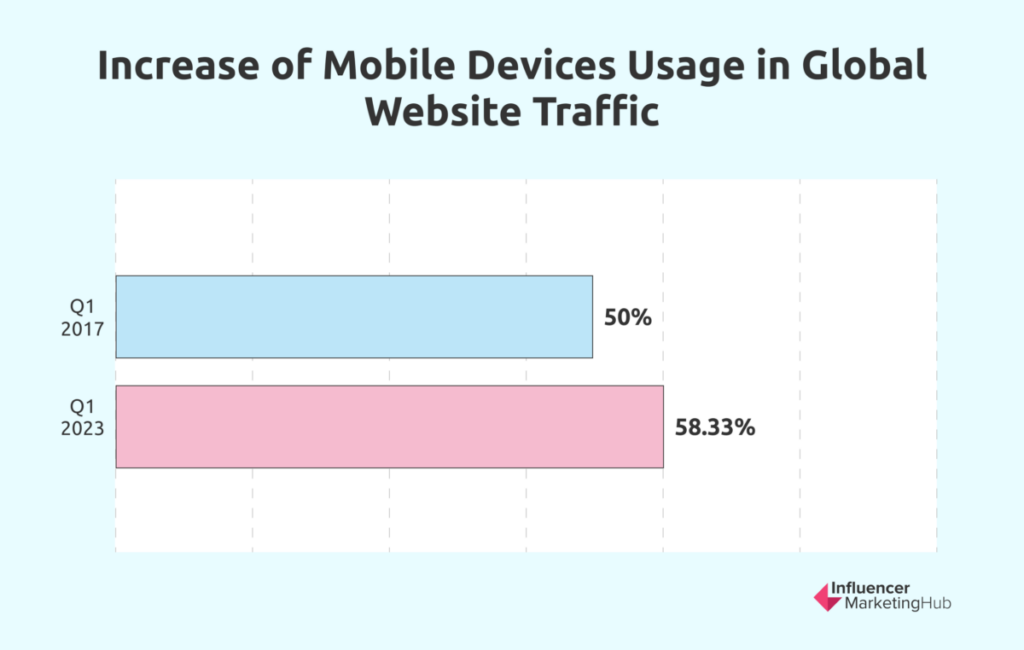
12. Mobile devices (excluding tablets) generated 58.33% of global website traffic in Q1 2023 (Statista). Mobile’s share reached 50% in Q1 2017 and hovered near that figure over the next few years. There has been a noticeable jump in the use of mobile devices in 2022, however. Many emerging digital markets completely skipped the desktop internet phase and moved straight onto mobile internet via smartphone and tablet devices. India, for example, has a sizable mobile-first online population.


13. Mobile email accounts for over 61.9% of email opens, depending on your target audience, product, and email type (EasySendy). This is a sizable range and indicates that developers must cater to mobile-equipped and desktop-using audiences.
Web Browser Statistics
14. Nearly 2/3 (63.55%) of web traffic is now served by Chrome (StatCounter). Safari takes second place with 19.95% of web traffic, followed by Microsoft Edge (5.14%), Firefox (2.79%), Opera (2.98%), Samsung Internet (2.38%), and UC Browser (1.01%), leaving “Other” (0.18%). Despite Microsoft’s loss of market share from the days when Internet Explorer dominated, they will be pleased to know that Edge had the most significant year-on-year change (14.9%), predominantly at the expense of Firefox.
15. Google.com is the most visited website (2023). In probably the least surprising news in this post, SEMrush reported that Google was the most visited website in July 2023 (with 95.5 billion visits), followed by YouTube (83 billion) and Facebook (11.5 billion). These statistics also give a good indication to web developers of the importance of catering to repeat visitors.
Web Developer Demographic Statistics
This section will look at the demographics of (predominantly US-based) web developers. It could be interesting to compare these with the results of our recent Diversity, Equity & Inclusion (DEI) in Influencer Marketing report. Are the demographics of web development significantly different from those of online influencers?


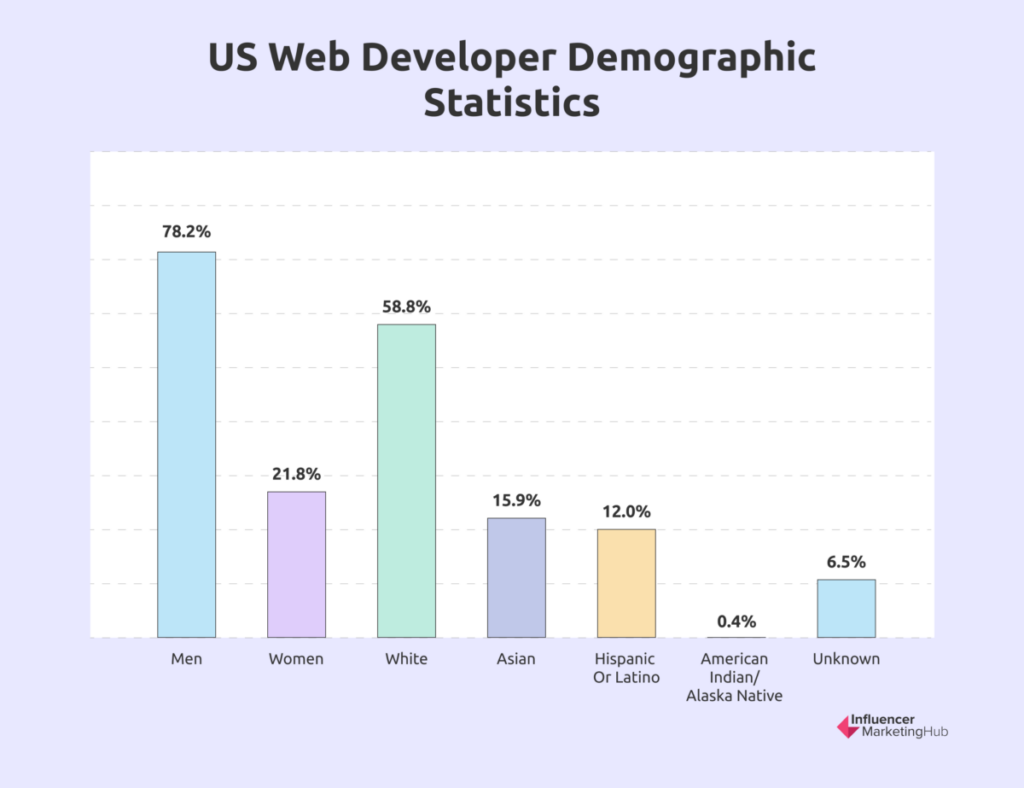
16. 78.2% of US web developers are men, meaning 21.8% of US web developers are women (Zippia). As imbalanced as this is, there has unfortunately been some backward movement in recent years. As recently as 2018, women made up 28.05% of web developers. Indeed 26.47% of web developers were female in 2010.
17. 58.8% of US web developers are white. There is surprisingly little diversity among US web developers, although there has been a (slight) positive trend over the last decade. The non-white races identified by developers in 2019 were Asian (15.9%), Hispanic or Latino (12.0%), American Indian/Alaska Native (0.4%), and “Unknown” (6.5%).
18. Asian web developers have the highest average salary compared to other ethnicities. This is particularly interesting when you remember that Zippia’s report focuses on web development activity in the USA. Asian web developers have an average salary of $82,334, followed closely by white web developers ($79,264). Black or African American web developers receive, on average, $78,067. Hispanic or Latino web developers have the lowest average salary at $75,754.
19. The average age of web developers in the USA is 36 years old. While this may surprise some people, with the stereotypical image of a web developer being a teenager or someone in their early 20s, it is a fair guide to how long people have been developing websites now. Indeed, 43% of US web developers are aged 30-40 years old, with a further 34% aged over 40. Only 23% of web developers are aged in their 20s.
20. Only 2% of US web developers lack degrees, having just high school diplomas. The vast bulk (71%) have Bachelor-level degrees, with 14% having Masters-level degrees, 11% Associate degrees, and 2% “Other.”
21. 47% of all web development jobs in the US are in organizations with >10,000 employees. Clearly, most small businesses outsource their web development, with only 5% of employees working for companies with fewer than 1,000 employees.
22. More than half (43%) of US web development jobs occur in public companies. Clearly, one of the reasons for the large average size of organizations employing web developers is the sizable number of positions in public companies. Notably, only 1% of web developers work in government jobs.
Web Developer Salary Statistics
The average salary for a web developer in the US is $79,753 per year. The average annual salaries for web developers in the U.S. can vary significantly, influenced by numerous factors such as the company, the nature of the project, individual skill-set, geographical location, among others. Here are the average salaries of web developers on the top job sites:
- ZipRecruiter: $87,739
- Glassdoor: $81,944
- Economic Research Institute: $100,391
- PayScale: $62,873
- Indeed: $82,893
- U.S. News: $77,030
- CareerExplorer: $69,038
- SimplyHired: $79,248
- Salary: $76,623
23. 57% of Web Developers in the United States think their salaries are enough for the cost of living in their area.
24. According to Indeed, the highest paying cities for Web Developers in United States are San Francisco ($127,499/year), Atlanta ($102,335/year), and Houson ($97,717/year).
25. Backbone.js is the best-paid skill for a Web Developer in the US. Web Developers with this skill earn +46.17% more than the average base salary, followed by Angular (26.87%), and Node.js (19.61%).
Web Design Statistics
26. You have 50 milliseconds to make a good first impression on visitors to your site (Taylor & Francis Online). According to a series of studies ascertaining how quickly people form an opinion about web page visual appeal, you don’t have long to impress potential visitors to your site. If visitors don’t like your design (or your web developers have implemented it poorly), expect people to look elsewhere.
27. It takes 2.6 seconds for eyes to settle on key areas of a web page (CXL). Studies show that it only takes the average user 2.6 seconds to land on the area of a website that most influences their first impression. The better the first impression, the longer visitors stay on a page. Researchers found the six website sections that drew the most interest from viewers are (in order) the site’s logo, the main navigation menu, the search box, the site’s main image, the written content, and the bottom of the website. If you want people to make a more extended visit, you must ensure that at least these six elements look great on your site.
28. 85% of website visitors think a company’s mobile website should be as good or better than its desktop website (Zippia). The small screens of mobile phones may make it challenging when designing a website, but with the preponderance of mobile users and their UX expectations, you can’t ignore their UX expectations.
29. The average cost to develop a website is $3200 (GoodFirms). GoodFirms Research surveyed 200+ web design agencies in the USA, Ukraine, and India. While 35.1% of the participants quoted their clients between $1000 to $1500, 13.51% charged between $5000 and $6000. The overall average was $3200.
30. Features and functionality are the main factors affecting the cost of web design. Other important factors include UI/UX design and responsiveness to mobile devices.
31. 80.7% of web designers get sites ready within one month (GoodFirms). GoodFirms asked their respondent web development agencies how long it typically took to design a website with all the necessary features. The vast majority did so within one month, although 11.5% took three months or more.
32. Professional web designers prefer to use the Adobe suite of products. No, this isn’t an ad for Adobe. GoodFirms collected information about what their respondents felt were the best tools available for web designing. 88.5% opted for Adobe Photoshop, with 76.9% also using Adobe Illustrator and 23.1% Adobe InDesign. The notable exception to this pattern was that 75% use Sketch (a digital design toolkit on the Apple MacIntosh.)
33. 50% of consumers believe that website design is crucial to a business’s brand (Top Design Firms) – this finding emphasizes that companies need to prioritize web design.
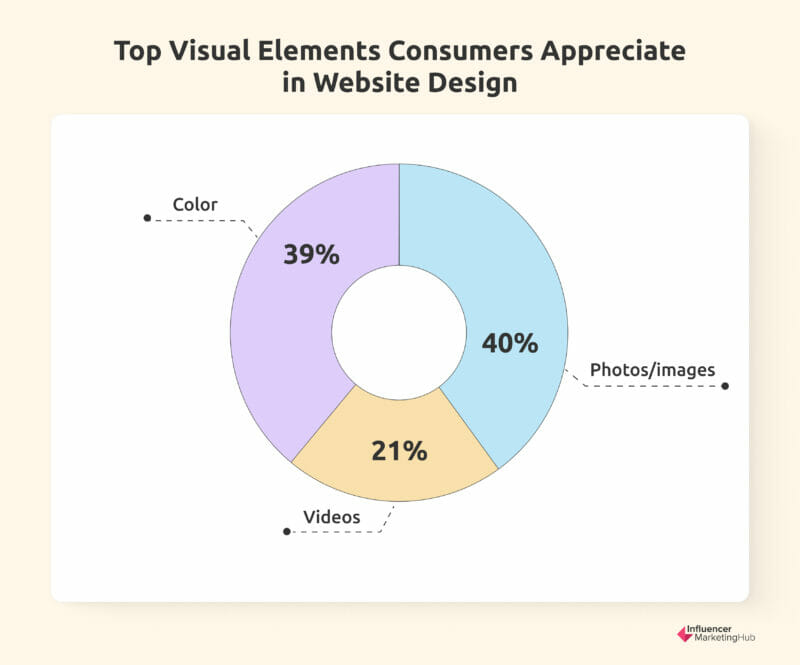
34. Photos/images (40%), color (39%), and videos (21%) are the top visual elements consumers appreciate in website design. So again, businesses need to think carefully about the design of their websites and not just go for “cheap and easy.” While the internet has dramatically widened your potential market, it has also increased your competition, allowing people to access millions of websites from their mobile phones. Top Design Firms also found that blue (46%) and green (30%) are the top color preferences for consumers who visit business websites.


35. The most common web design error made by SMBs is having a crowded web design. 84.6% of GoodFirms respondents cited this as a significant web design error, followed by not having a Call-to-Action (38.5%) and hidden navigation (30.8%).
36. If given only 15 minutes to consume content, 59% would prefer to browse something beautifully designed (Adobe). Conversely, a mere 41% prefer something simple and plain. Numbers are even more extreme if you focus solely on US citizens. Here, Adobe found that 66% prefer to look at a beautifully designed site, compared to 34% favoring something simple and plain.
WordPress Statistics
37. WordPress is used by 43.1% of all websites (w3 Techs). That’s 63.1% of all websites that use some form of content management system. Additionally, 73.4% of WordPress websites use the current Version 6.
38. 20.6% of all WordPress websites use Elementer. This makes Elementer WordPress’s most popular plug-in, followed by WooCommerce (20.5%) and WPBakery (12.4%).


