The influence of AI on the economic growth of different regions in China

Artificial intelligence industry is a very broad field, it refers to the artificial intelligence technology as the core, by the foundation support and application integration of the industry. Basic support is mainly composed of information data and calculation ability support, which provides basic elements for the development of artificial intelligence technology and its industry; Integration specifically refers to various subsectors including intelligent finance, and robotics. From the industrial level, the artificial intelligence industry: one is the industry with artificial intelligence technology as the core. Such industries directly provide products and services through artificial intelligence technology itself, effectively improving the efficiency of industrial operations. The other is the artificial intelligence technology integration industry. This kind of industry is mainly through the innovative integration of artificial intelligence technology and traditional industries, so as to upgrade traditional industries and form new intelligent industries. These two types of artificial intelligence industries are based on artificial intelligence technology as the core element of development, with intelligent agglomeration, data-driven, information sharing and other characteristics.
Artificial intelligence industry index selection and data sources
The data used in this paper is primarily sourced from various Chinese statistical yearbooks covering the period from 2008 to 2022, including the China Statistical Yearbook, China High-tech Industry Statistical Yearbook, China Science and Technology Statistical Yearbook, and China Electronic Information Industry Statistical Yearbook.
Artificial intelligence industry index measurement
Although the selection of artificial intelligence industry index construction considers the development of artificial intelligence industry from different aspects, there is still a correlation between various indicators. Therefore, in order to further reduce the correlation between indicators, this paper adopts the global principal component analysis method to combine these 15 indicators into a comprehensive index, namely, artificial intelligence industry index. In this paper, the SPSS22 econometric and statistical software is used to conduct principal component analysis on the AI industry development indicators of 30 provincial cities in China from 2008 to 2022, and then the AI industry development index is constructed.
The test results of this paper show (Table 1) that the appropriate measure value of KMO sampling is 0.72, greater than 0.6, which meets the prerequisite of principal component analysis, indicating that the artificial intelligence industry index data is suitable for principal component analysis (p < 0.05). Determine the principal component factors. According to the theoretical experience of principal component analysis, it is more appropriate for the component with eigenvalue greater than 1 to be the principal component. When the eigenvalue is greater than 1, only the first two components are available, and the cumulative variance contribution rate is 82.03%, indicating that these two components can fully reflect the information of the original data. Therefore, we extract these two components as the main components and record them as F1 and F2 respectively.
Regression estimation method was used to calculate the factor score coefficient and the weight of each index, see Table 2.
Determine the artificial intelligence industry index. According to the results of principal component analysis, the development index of artificial intelligence industry is determined. Artificial intelligence industry (AI) is used to represent the artificial intelligence industry, and the artificial intelligence industry index is expressed as14:
$$ {\text{AI}} = 0.1301{\text{S}}1 + 0.2344{\text{S}}2 + 0.0985{\text{S}}3…… + 0.1960{\text{S}}7 $$
(1)
According to previous research, the development level of artificial intelligence industry in each province is standardized:
$$AI=\frac{Fi}{maxFi-minFi}$$
(2)
where Fi is the comprehensive factor score of i province. The maxFi and min Fi are the maximum and minimum values of comprehensive factor scores corresponding to province i.
Calculation results and analysis of artificial intelligence industry indicators
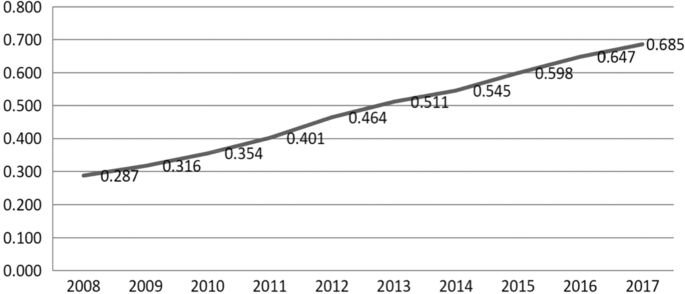
From the perspective of the overall change characteristics: from 2008 to 2017, with the comprehensive optimization of China’s artificial intelligence industry development policy, the steady improvement of innovation capacity, the continuous consolidation of the industrial foundation, the continuous improvement of the development environment, and the continuous deepening of integration and application, the development of artificial intelligence industry in 30 provinces in China showed a good trend of rising year by year. This is the result of the state’s strong support for the construction of intelligent industries, continuous promotion of artificial intelligence technology innovation and progress, and the rapid development of artificial intelligence industry in the whole society. Our research shows the artificial intelligence industry development index and its average national artificial intelligence industry during 2008–2017, and Fig. 1 shows the overall trend of the average national artificial intelligence industry development level during 2008–2017. China’s artificial intelligence industry development index is 0.481, which is higher than the national average level of artificial intelligence industry development in 15 provinces, of which Beijing (1.033), Shanghai (0.946), Jiangsu (0.876), Guangdong (0.867) and Zhejiang (0.830) are ranked in the top 5 in China’s artificial intelligence industry development. Shanxi (0.189), Gansu (0.160), Xinjiang (0.159), Hainan (0.061), and Qinghai (0.052) are ranked in the bottom 5 of China, among which Hainan is divided into the eastern region, but its economic development and scientific research level are still a certain gap with other eastern regions, so the development level of artificial intelligence industry is low. This shows that the development trend of China’s artificial intelligence industry is similar to that of economic development, and also shows a decreasing trend year by year from the southeast coast to the northwest inland.
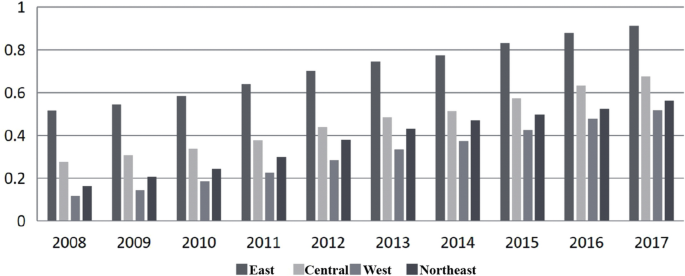
From the perspective of regional fluctuation characteristics (as shown in Fig. 2): 1. The average development index of industrial intelligence industry is 0.713, exceeding the national average level of 0.232, and is in an absolute leading position. In the eastern region, Beijing and Shandong, relying on the construction of smart city clusters around the Bohai Sea economic Circle, have core competitive advantages in intelligent technology research and development and intelligent industry cultivation. Revised: Leveraging the manufacturing hub of the Yangtze River Delta Economic Belt, Shanghai, Jiangsu and Zhejiang have actively advanced intelligent manufacturing technologies such as the Internet of Things and cloud computing, driving widespread development of the artificial intelligence industry across various social and economic sectors. Building on the competitive edge of the Pearl River Delta Economic Circle and the Guangdong-Hong Kong-Macao Greater Bay Area, Guangdong will further enhance its strategic layout and construction in the artificial intelligence industry to achieve leading-edge development in this field. 2. Balanced development of the central region. The average development index of artificial intelligence industry in the central region is 0.462, and the development is balanced within the region. Among them, the development level of artificial intelligence industry in Anhui (0.587), Henan (0.523) and Hubei (0.563) is relatively close, and is in a higher position in the central region. 3 Polarization in the western region. The average index of artificial intelligence industry development in the western region is 0.309, lagging behind the national average level of 0.172, and the development in the region is significantly polarized. The combination of policies and industries in Sichuan and Chongqing has effectively promoted the rapid development of the artificial intelligence industry, and the artificial intelligence industry index ranks 9th and 16th in the country respectively. Shaanxi and Guizhou have outstanding advantages in science and technology research and development and big data application, accelerating artificial intelligence and industrial development. The development level of artificial intelligence industry in other western regions is relatively backward. 4. The level of northeast China is not high. The average development index of artificial intelligence industry in Northeast China is 0.378, higher than the level of western regions, but still lower than the national development level of 0.103. Among them, Liaoning’s artificial intelligence industry development index of 0.554 is higher than the national average, ranking first in Northeast China. The overall level of development of artificial intelligence industry in Northeast China is not high, which may be related to factors such as insufficient internal impetus for economic development in Northeast China, difficulty in converting old and new economic momentum, small scale of development of artificial intelligence industry, and insufficient investment.
This paper analyzes the impact of the artificial intelligence industry on high-quality economic development by incorporating the artificial intelligence industry development index into the framework of analysis. In order to account for the dynamic nature of high-quality economic development, we also include a first-order lag variable of the explained variable in our analysis.
$$ HQD_{it} = B_{0} + B_{1} HQD_{it – 1} + B_{2} AI_{it} + B_{3} X_{it} + E_{it} $$
(3)
In the above formula, t and i respectively represent different years and provinces; HQDit = the high-quality economic development index of the i province in the t year; HQDit-1 = the high-quality economic development index of the i province in the one period lagging behind; AIit = the artificial intelligence industry development index of the i province in the t year; Xit = the control variable of the i province in the t year. B0 represents the intercept term, Eit = the random error term. B1,2,3 = parameter to be estimated, B2 = the influence coefficient of artificial intelligence industry on high-quality economic growth. Considering the economic meaning of regression coefficient, and in order to increase the smoothness of data, logarithmic processing is carried out on the variables of artificial intelligence industry index, economic high-quality development index and technological innovation.
The findings indicate that the artificial intelligence industry index, as the core explanatory variable, has a positive impact on high-quality economic development and passes the significance test at the 1% level. Economic development is a continuous process of gradual transformation.


