Why China Will Lead In Electric Vehicles

This article will discuss the distinct advantages that China has for moving more aggressively toward electric vehicles (EV), along with the key driver that is leading China to EVs. It has both monetary and environmental incentives to accelerate toward EVs.
Advantages
The key advantages China currently enjoys in its quest for world EV production and cost leadership are the following:
- Economies Of Scale
- Swift, Autocratic Policy Decisions
- Battery Raw Materials Control
- Domestic Coal Supply & Low Cost Coal Electricity Production
Economies Of Scale
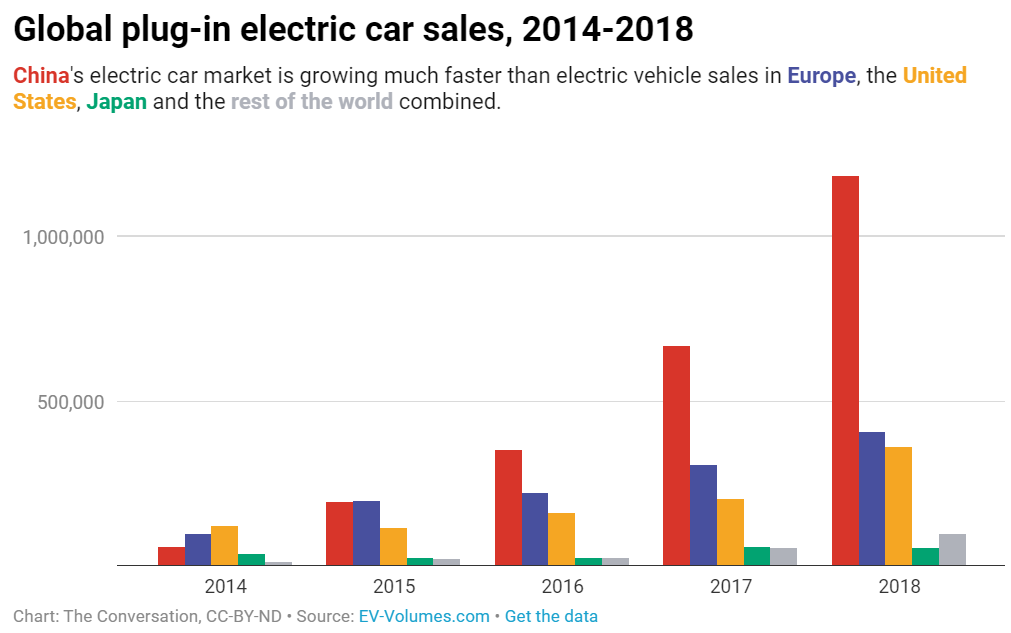
China’s economy has seen tremendous change over the last 20 years, averaging a compounded annual 14.19% growth rate. With this domestic growth engine for a large population of 1.39 billion, average per capita incomes have increased by a 20-year compounded annual rate of 10.72%. Increasing prosperity with more of its people wanting greater mobility, has provided China with a huge domestic market for EVs. In 2018, more EVs were sold in China (23 million) than in the rest of the world combined, as shown in Graph 1 below.
Graph 1 – Global plug-in electric car sales, 2014-2018
Swift, Autocratic Policy Decisions
The Chinese government is mandating more EVs at the expense of internal combustion engines (ICE) compared to Western democracies, while reducing the number of licenses available for gasoline-powered cars. This policy from the top, President of the Republic of China, Xi Jinping, will increase demand for EVs leading to greater EV production, larger economies of scale, and lower unit production costs. This will enable China to gain a world-wide marketing advantage. In the Chinese system, no Act of Congress and debate is necessary, so quick, decisive action to provide advantages to China are implemented.
Battery Raw Material Controls
China now has a tight grip on the global supply of the elements needed to manufacture batteries from four components: anode, cathode, separator, and electrolyte. China currently controls between 50% and 77% of the global market for the raw materials of these components, according to Yano Research Institute. A key element of an electric vehicle’s price is the cost of its batteries, and China already makes more than half of the world’s electric vehicle batteries.
According to an analysis by BloombergNEF, in early 2019 there were 316 gigawatt-hours (GWh) of global lithium cell manufacturing capacity, and China is home to 73% of this capacity, followed by the U.S., far behind in second place with 12% of global capacity.
China controls more lithium reserves and much greater lithium production than the U.S., and in 2018, Chinese lithium production was 8,000 metric tons, third among all countries and nearly ten times U.S. lithium production. Researching the capital devoted to lithium over the past few years, over 50% has been by the Chinese.
Domestic Coal Supply & Low Cost Coal Electricity Production
China has a large, low-cost domestic coal supply, yet it also imports significant amounts of coal to supply its electricity generators.
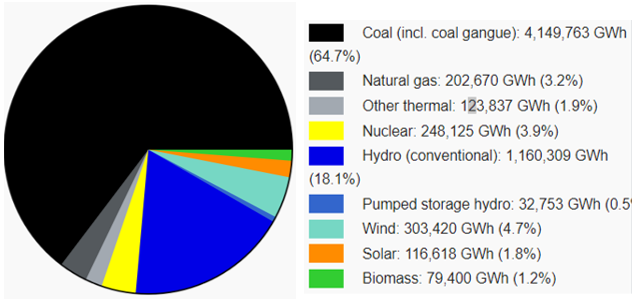
Chinese electricity generation by source in 2017 is shown below in Graph 2.
Graph 2 – Chinese Electricity Generation By Source in 2017
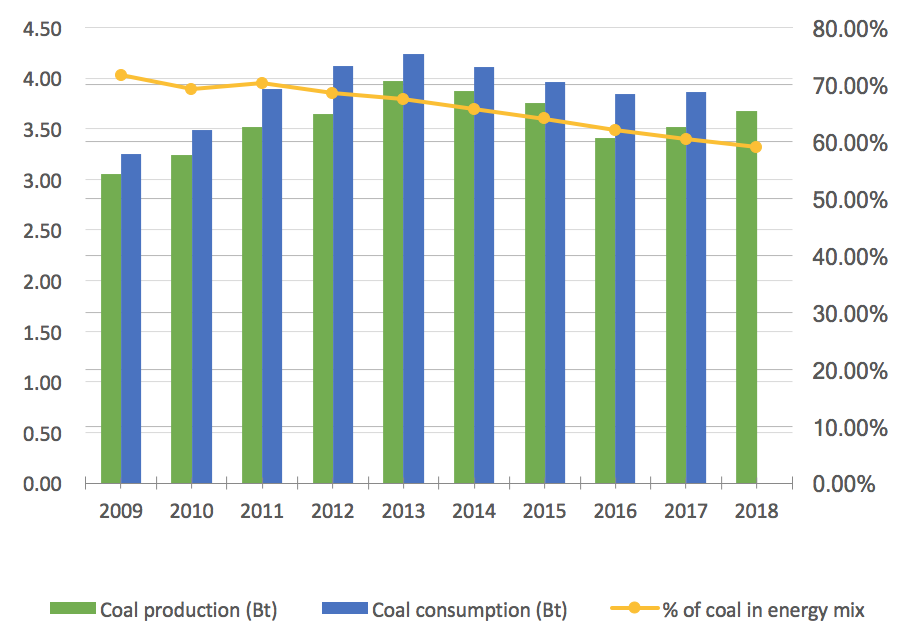
Chinese use of coal has been on decline since 2014 as coal’s share of overall energy supply is below 60% for the first time as shown in the Graph 3 below. Despite increases in recent coal use in response to its slowing economy, use of coal is on a downward trajectory. With low coal-fired energy costs, a slowing economy may trigger more coal use vs. imports of petroleum, liquids, and LNG.
Graph 3 – Chinese Coal Production, Coal Electricity Generation
To put China’s coal use in perspective, from 2005-2009, China added the equivalent of the entire US coal generation. From 2010-2013, it added 50% of the entire US coal generation. China burns 4 billion tons of coal a year; the US burns less than 1 billion; EU burns about 0.6 billion. This volume of coal consumed in China represents about 9.12 billion tonnes of CO2 emissions per year.
Key Driver For Chinese EV Production
China Is A Major Petroleum & LNG Importer
The country is experiencing increasing and high domestic demand for petroleum and LNG, yet the domestic upstream industry is unable to satisfy it. One of the reasons is that China’s upstream sector is dominated by its national oil companies (NOCs) and private sector participation in China’s can only happen with contracts with the NOCs. Operating costs for domestic Chinese production have remained relatively high in comparison to the United States.
Another reason limiting domestic gas production is that China’s shale gas resource lies at depths greater than 3,500 meters, and available technology is not easily adapted for this depth.
China will continue to import large amounts of crude and petroleum products to meet demand as shown in the Graph 4 below.
Graph 4 – Net Imports of Petroleum and Other Liquid Fuels Comparing China and US
.png)
Additionally, since Chinese shale gas is currently inaccessible, it continues to import natural gas via pipeline and LNG terminals. Natural gas and LNG imports are both increasing due to China’s continued need for more energy in tandem with a flattening of coal-fired energy production.
China imported 54 million metric tons of LNG in 2018, a year-on-year increase of 42 percent. LNG imports from the US stood at 2.1 million tons, accounting for 4 percent of the total. Graph 5 below provides an LNG import history.
Graph 5 – Chinese Natural Gas Imports By Pipeline & LNG, 2014-2018

Therefore, being short of both petroleum and natural gas, the Chinese must import and give up hard currency. By reducing fossil fuel imports, China could reduce its balance of payments, however, the type of fossil fuel imports matters greatly when the prices of energy in fossil fuels, shown as United States Dollars (USD) per British Thermal Unit (BTU) are compared.
S&P Global Platts publishes a daily price assessment for LNG shipped to Japan, South Korea and Taiwan on a delivered ex-ship basis, or its JKM Marker. The JKM Marker will be used as a proxy for LNG pricing into China for this exercise. Platts also publishes a daily price assessment for Australian thermal coal shipped to Japan’s Kinuura port, the Northeast Asia Thermal Coal index, abbreviated to NEAT. The two-year history of JKM Marker and NEAT pricing is shown below in Graph 6, and the differential between the two in Graph 7.
Graph 6 – JKM vs. NEAT Weekly Average Price Comparison

Graph 7 – JKM vs. NEAT Weekly Price Difference

Since China imports large quantities of crude, the Brent oil price will be used as a proxy for the imported oil price delivered to China for this exercise as shown below in Graph 8. The comparison of coal, LNG, and crude pricing will use the 21 Oct 2019 Brent price of $58.95 per barrel. Of concern to the Chinese has to be the upward trajectory of Brent crude prices since 2017, and the threat that will continue into the future.
Graph 8 – Brent Crude Oil 3-Year History

With a current Brent crude price of $59.00 per barrel, the cost is $10.17 per MMBTU. Evaluating the imported fossil fuels China has at its disposal of coal, LNG, and crude/diesel, the current spot prices used for this brief summary will be:
Coal: $3.80 per MMBTU
LNG: $6.57 per MMBTU
Crude/Diesel: $10.17 per MMBTU
Summary Of China’s Fossil Fuel Consumption:
- 4 billion tonnes per year of coal for electricity production and steam generation, a market value of $337 billion per year.
- 54 million tonnes of LNG each year, a spend of $18 billion per year
- 8.61 million barrels of crude oil and refined products (diesel) per day, a spend of $185 billion per year
- Total imports represent annual fossil fuel value of $540 billion
Imported Fuel Switch Impact From Crude/Refined Products to LNG:
Replacing 8.61 million barrels of crude oil/refined products with LNG would save China $246 billion per year, and ~400 million metric tonnes of CO2 per year`
Converting LNG to electricity for transportation energy demand is more efficient than the ICE alternative with crude/refined products/diesel for the import dollar expended.
The probability for conversion of coal-fired electricity generation plants to LNG appears remote, even if the environmental prize is eliminating 9.12 billion tonnes of CO2 per year. The cost to import LNG replacing coal would be around $246 billion per year, not counting infrastructure capital expenditure for import/regasification facilities.
I welcome your comments and questions, and the opportunity to assist you with your energy questions and concerns. You are welcome to review my previous energy articles at my LI profile. I am the principal at Reliant Energy Solutions LLC, a Certified Energy Manager, and can be reached at ron@reliantenergysolutions.com . My website is: www.reliantenergysolutions.com
Copyright © October 2019 Ronald L. Miller All Rights Reserved


