Artificial intelligence-based real-time histopathology of gastric cancer using confocal laser endomicroscopy

Dataset
A total of forty-three fresh tissue samples were obtained from patients diagnosed with gastric cancer. Tumor and normal gastric tissue samples were concurrently collected from each patient. The enrolled samples encompassed various clinicopathologic features of gastric cancer, including histological subtypes and tumor stage (Supplementary Table 6). The tissue specimens were precisely cut to dimensions of 1.0\(\times\)1.0\(\times\)0.5 cm and subsequently subjected to imaging using the CLES. Approval for this study was obtained from the Institutional Review Board (IRB) at Ajou University Medical Center, under the protocol AJIRB-BMR-KSP-22-070. Informed consent requirements were waived by the IRB due to the utilization of anonymized clinical data. The study strictly adhered to the ethical principles delineated in the Declaration of Helsinki.
Confocal laser endomicroscopic system image acquisition
The CLES device used in this study follows a mechanical configuration described in our previous work3. The microscopic head and 4 mm diameter probe are positioned near the tissue, with a 488 nm light emitted from the light source (cCeLL-A 488, VPIX Medical) transmitted through an optical fiber to the tissue. The tissue, pre-applied with fluorescent dye, absorbs and emits longer-wavelength light (500–560 nm), transmitted back to the main unit through optical fibers in the probe. A stage holding the probe ensures stability during image capture. Tissue scanning utilizes a Lissajou laser-scanning pattern, allowing image acquisition up to 100μm from the tissue surface.
For tissue staining, fluorescein sodium (FNa; Sigma–Aldrich) dissolved in 30% ethanol (0.5 mg/ml) was carefully applied to the tissue sample, incubated for one minute, and rinsed with phosphate-buffered saline. After delicate cleaning to remove dye aggregates, CLES imaging captured dynamic grayscale images (1024\(\times\)1,024 pixels) with a field of view measuring 500\(\times\)500 μm. Gastric cancer and non-neoplastic tissue were scanned from the mucosa to submucosa and muscularis propria, averagely producing 500 images per tissue piece (Supplementary Fig. 1).
Histologic evaluation of the specimen
Following the CLES imaging, tissue samples were subjected to H&E staining after fixation in 10% formalin and the creation of formalin-fixed, paraffin-embedded (FFPE) blocks. Sections of 4 μm thickness from these FFPE blocks were stained with H&E. The stained slides were then scanned at 40\(\times\) magnification using the Aperio AT2 digital whole-slide scanner (Leica Biosystems). For the precise evaluation of CLES images alongside H&E-stained images, the acquired CLES images were vertically stitched from mucosa to subserosa and subsequently directly compared to the H&E images of the tissue at the same magnification (Supplementary Fig. 2). Histologic structures such as vessels or mucin pools served as landmarks for identifying the exact location. The determination of whether the CLES images from gastric tumor samples indeed contained tumor cells was facilitated through this direct comparison with the mapped H&E images. The mapping of CLES images and H&E images were conducted by experienced pathologists with gastrointestinal pathology subspecialty (S.K., and D.L.).
Development of the artificial intelligence model
Preprocessing
Supplementary Table 7 outlines the acquisition of the entire 7480 tumor images and 12,928 normal images for the development and validation of the AI model. Each original image, sized at 1024\(\times\)1,024 pixels, was resized to 480\(\times\)480 pixels to align with the specifications recommended by EfficientnetV2 for CNN models24. These resized images underwent normalization, scaling their pixel values between 0 and 1 by dividing them by 255.
Classification model development
EfficientnetV2, a model achieving state-of-the-art performance in Imagenet 2021, and renowned for its high processing speed, was utilized for developing the tumor classification model (CNN 1) and the tumor subtype classification model (CNN 2)24. To determine the model capacity in terms of the number of layers and filters among the hyperparameters, we compared the performance of two variants of the EfficientNetV2 model: EfficientNetV2-S (with approximately 22 million parameters) and EfficientNetV2-M (with approximately 54 million parameters) after training. The EfficientNetV2-S model was selected due to its superior performance. Experimentation revealed that when employing high learning rates such as 0.1 or 0.001, overfitting occurred early in the epochs, leading to a bias towards either tumor or normal classes. Hence, a lower learning rate of 0.0001 was employed to encourage the model to converge gradually during training.
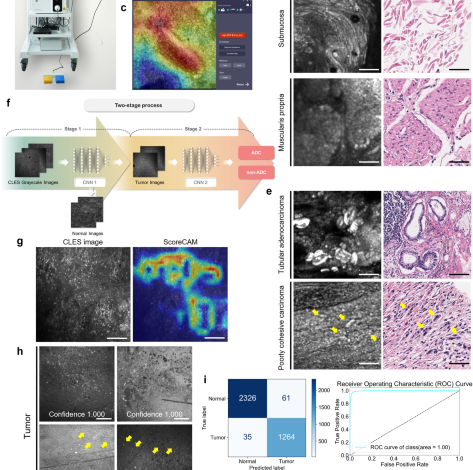
We conducted 5-fold cross-validation of the two models, allocating 80% of the entire dataset for training and the remaining 20% for testing. To achieve a balanced ratio between tumor and normal classes during training and mitigate overfitting caused by class imbalance, we down-sampled the normal image set to align with the number of tumor images. This down-sampling process involved random sampling with a fixed seed value. As a result, among the preprocessed images, 5984 tumor images and 5984 normal images (in a 1:1 ratio) were utilized in training the AI model. The final performance was calculated as the average and standard deviation of the accuracy, sensitivity, and specificity among the folds. Each model is trained for 50 epochs in each fold with batch size 16, AdamW optimizer with a default parameter, and cross-entropy loss function. In order to derive better generalization performance in the training process, data augmentation techniques such as flip and rotation were applied. As depicted in Fig. 1f, we developed a two-stage process that distinguishes the tumor and the subtype of the CLES image with the two CNN models mentioned above. (1) In the first stage, the input CLES image is determined as tumor or normal by CNN 1. In the sigmoid output of the CNN 1 model for the image, it is indicated as a tumor if it is greater than 0.5, or if it is less, it is indicated as normal. (2) In the second stage, CNN 2 classifies the tumor subtype of the tumor-determined CLES image. As in the first stage, if it is greater than 0.5 in the CNN 2 sigmoid output of the input tumor image, it is classified as ADC, or if it is less, then classified as non-ADC. To determine the threshold value as 0.5, we compared the performance of the model across different thresholds by considering precision and F1 score, as shown in Supplementary Tables 8 and 9. The optimal threshold for each fold was determined using Youden’s index25, resulting in values of 0.506, 0.508, 0.523, 0.573, and 0.546, respectively. 1496 tumor images and 2586 normal images were utilized for the test in each fold. Despite the slight enhancement of performance with the thresholds calculated from Youden’s index, we decided to utilize the median value of the sigmoid function, 0.5, as the default threshold because the true positive rate and true negative rate exhibit variability depending on the chosen threshold, potentially introducing bias towards specific classes. Following the model development, 3686 images were utilized for the internal validation of the model performance.
Activation map analysis
The activation map of the CNN 1 model was created using Score-CAM to determine whether the CNN 1 model trained the imaging features related to the tumor normally. Score-CAM removes dependence on the slope by acquiring the weight of each activation map through the forward pass score for the target class, and the final result is obtained by a linear combination of the weight and the activation map, so it shows an improved result compared to the previous class activation map20. As shown in Fig. 1g, in the activation map, the area activated in the CNN 1 prediction is shown in red.
External validation of the standalone performance of the artificial intelligence model and pathologists’ performance
The standalone performance assessment of the two-stage AI model in detecting tumor images involved the utilization of 43 tumor images and 57 normal images from 14 patient samples. Metrics such as sensitivity, specificity, and accuracy for detecting tumor images were calculated. Concurrently, four experienced pathologists independently analyzed the same validation dataset comprising 100 CLES images, determining whether each image contained tumor cells. Prior to the task, they underwent group training for interpreting CLES images conducted by an experienced gastrointestinal pathologist (S.K.) well-acquainted with CLES. In addition to the training, the four pathologists were provided with 200 CLES images and their corresponding H&E images for further study. Sensitivity, specificity, accuracy, and Cohen’s kappa value, in comparison to the ground truth data, were assessed.
A separate dataset of 100 CLES images, including 46 tumor images and 54 normal images from 15 patient samples, was presented to the pathologists in a distinct session. After their initial interpretation regarding the presence of tumor cells in each image, the AI interpretation results were disclosed to the pathologists for assistance, allowing them to revise their analytical results. Cohen’s kappa value was utilized to show inter-observer agreement. Sensitivity, specificity, and accuracy were also calculated both before and after the AI assistance to comprehensively evaluate the impact of AI support on the pathologists’ performance.
Statistical analysis
AUROC was used to evaluate the performance of the AI models. Cohen’s kappa was applied to evaluate the concordance of tumor/normal distinction between the ground truth and the interpreted result. All statistical analyses were carried out using Python 3.8 and R version 4.0.3 software (R Foundation for Statistical Computing).
Reporting summary
Further information on research design is available in the Nature Research Reporting Summary linked to this article.


