Democratizing Stateful Analytics Through Visual Programming

Key business outcomes in many domains entail stateful analytics — carefully analyzing sequence, ordering and timing between events over operational event streams. Writing such stateful analytics queries has been a longstanding open challenge. To address this, Conviva developed a novel no-code platform that democratizes the creation of complex stateful analytics used in various industries.
We recently demonstrated our platform, SEAM-EZ, in a paper titled “SEAM-EZ: Simplifying Stateful Analytics through Visual Programming,” presented at the premier international conference on human-computer interaction, ACM CHI 2024. SEAM-EZ stands for Stateful Event Analytics Made Easy, a tool that makes what used to be a complex problem seem easy.
What Is Stateful Analytics? Why Is It Important?
Stateful analytics over event streams entails carefully modeling the sequence, timing and contextual correlations of events to dynamic attributes. Consider these examples:
Example of stateful analytics from the fitness domain that requires carefully modeling sequence, timing and system context when processing event streams.
In this example, fitness tracker data shows a user’s stress and type of activity over time (e.g., start times of rest, work, run). We want to measure the duration of “high stress” when the user is “working” to help the user avoid prolonged stress exposure (e.g., suggesting breaks between meetings).
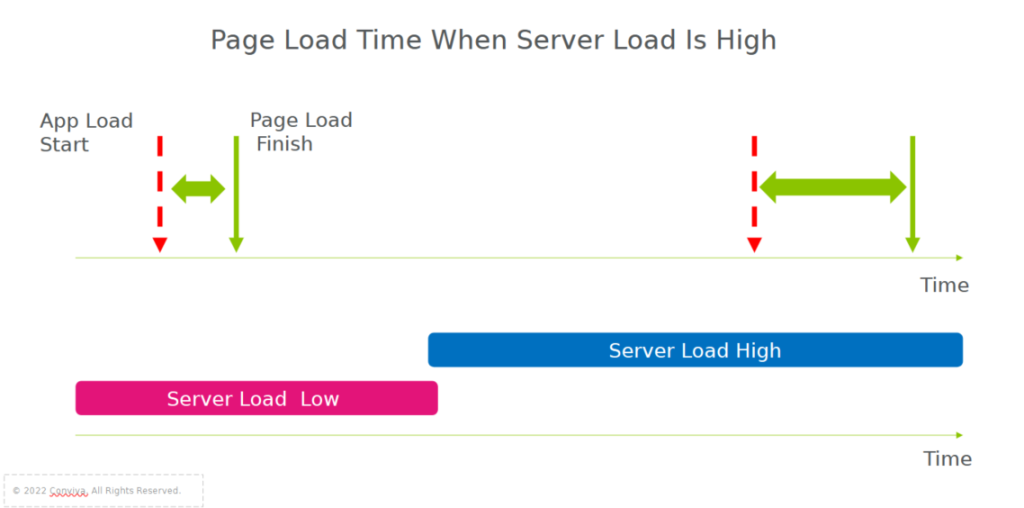
Example of stateful analytics from app monitoring data.
App developers may be interested in user experience, such as login time or load time, and might want to correlate experience with the backend load (e.g., is the load time high because of server load?).
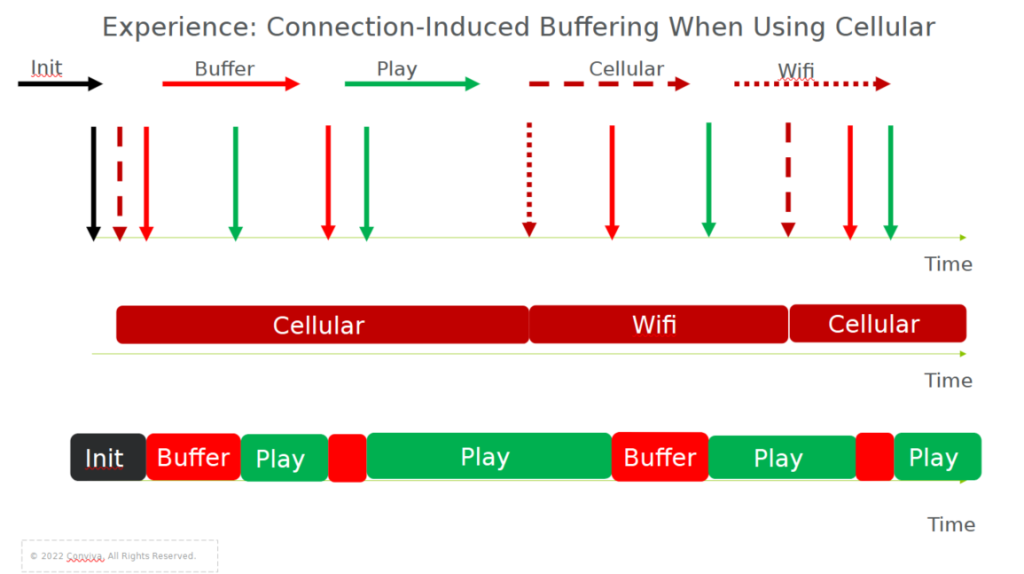
A simplified stateful analytics example from video quality of experience monitoring.
This example shows events from a video session, such as initialization, play, buffering and network status. In this case, the provider may be interested in measuring connection-induced buffering time, a key quality-of-experience metric. This metric requires carefully modeling the sequence of user events, ignoring buffering during initialization or user seeks, and correlating it with the network connection (e.g., cellular).
A fourth example: Internet of Things (IoTs) operators are interested in knowing if devices are in a “prolonged risky” state, for example high battery temperature above 60 Celsius and high memory usage, so that they can perform proactive/predictive maintenance.
To understand stateful analytics, it might be useful to contrast it with stateless analytics. Suppose you are interested in the total number of “red” events in the chart showing connection-induced buffering when using cellular data. This measurement will be the same irrespective of the sequence between red and green events, the time difference between the event occurrences and the current value of the server load.
In stateless analytics, you can logically view data as a “bag of events,” as simple computations like total and average are “stateless.” In contrast, stateful analytics involves carefully modeling time, sequence and order to compute metrics, such as the time between events, how long something lasted or what happened “when” or “before” an event happened.
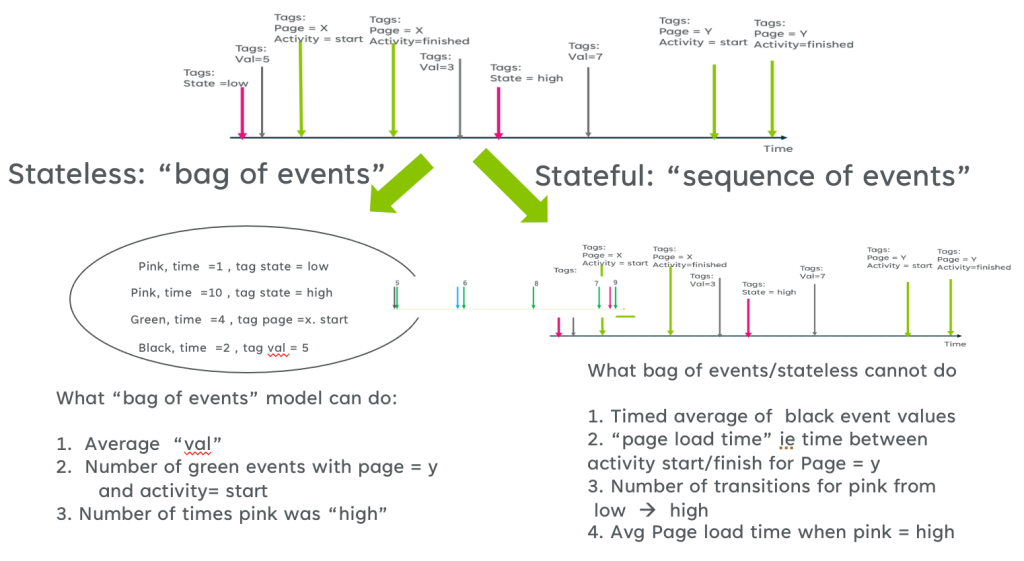
Stateless vs. stateful events
Why Is Stateful Analytics Hard?
However, creating stateful metrics in real-world settings is challenging in part due to the complexity of modeling processes evolving over time. Data scientists and engineers usually have to write and debug complicated SQL queries for stateful metrics, such as shown in the figure below. No one expects readers to read this code. That is the primary challenge: stateful analysis usually entails significant development and debugging complexity.
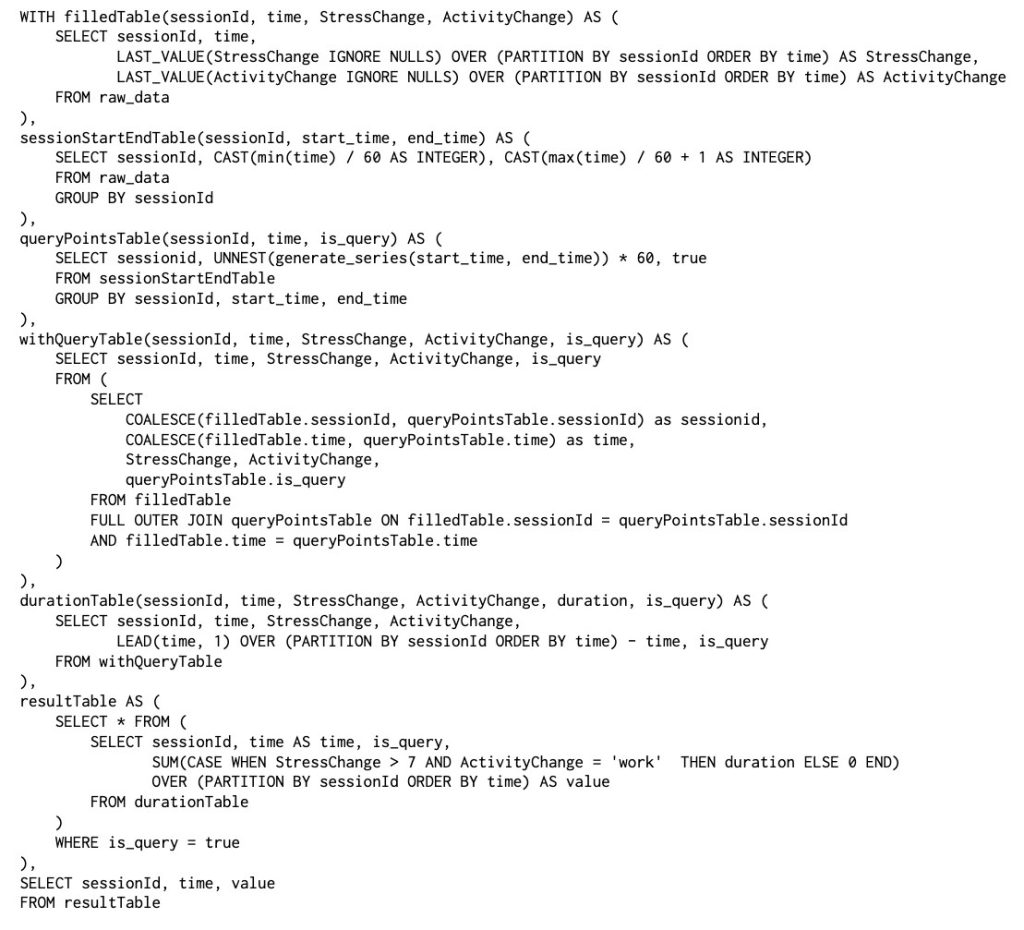
Example SQL code for stateful analysis of the fitness example above
Democratizing Stateful Event Analytics via Visual Programming
Our overarching goal is to simplify the complex and time-consuming process of creating stateful metrics. To do so, we combine Conviva’s TimeState framework with visual programming to democratize the stateful analytics problem.
The TimeState framework introduces an intuitive geometric “timeline” abstraction for manipulating complex event streams to create stateful metrics at scale. This framework is a paradigm shift that enables stateful analytics at scale. An equally important benefit of TimeState is that it enables a simple, easy-to-use visual programming interface for stateful analytics.
What Is Visual Programming?
Visual programming (VP), or directly using visual elements (e.g., blocks, lines) for constructing computer programs, was proposed by William Robert Sutherland in the 1960s. Since then, there has been a wide range of VP applications for various domains.
VP has been a powerful idea to lower the barrier of computer programming. One widely used VP tool is Scratch, which allows children to “write” computer programs by using visual elements such as blocks. We also see emerging usage of VP in the domain of machine learning applications such as the Google Visual Blocks system.
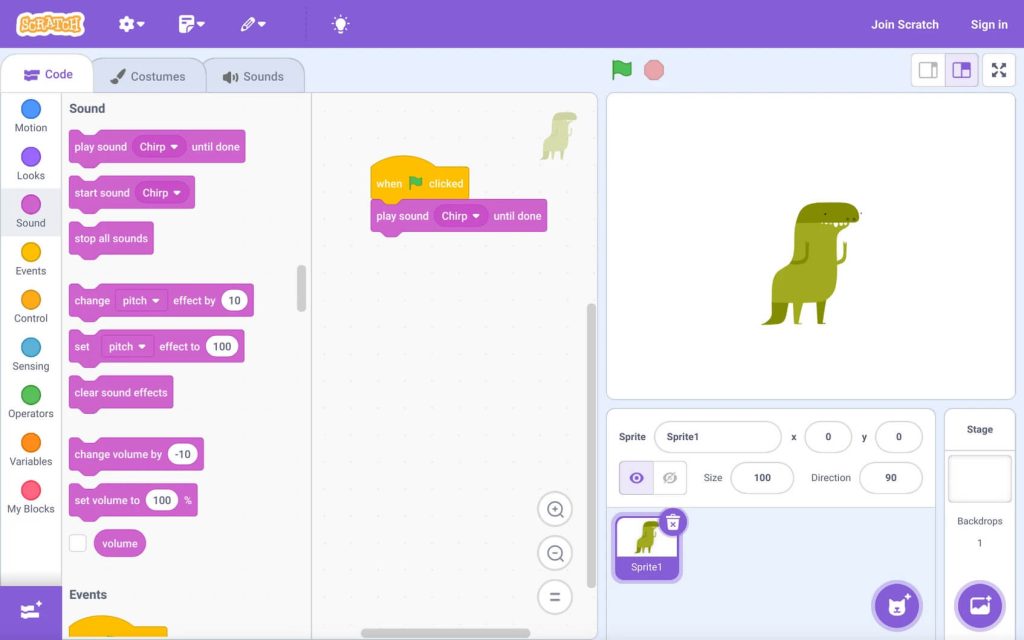
Scratch user interface, created by MIT
We were inspired by these earlier successes of VP in different domains and set out to leverage VP for democratizing the creation of stateful analytics using a no-code approach rather than the typical complex SQL approach.
What’s Next?
The positive reception SEAM-EZ received at CHI 2024 represents another step on our innovation journey. We continue to refine our tools to meet users’ sophisticated needs, adapt to new challenges and maintain our leadership in democratizing stateful analytics for operational use cases.
We anticipate that the foundations behind SEAM-EZ will reshape the landscape of operational data analytics, simplifying complex processes and making high-level tools accessible to a broader audience.
For more information about SEAM-EZ and its straightforward, drag-and-drop user interface (UI), watch the following video.
YOUTUBE.COM/THENEWSTACK
Tech moves fast, don’t miss an episode. Subscribe to our YouTube
channel to stream all our podcasts, interviews, demos, and more.